


In this section we have gathered most useful and essential Aurora short term forecasting live data streams (click browser's Refresh button to update).
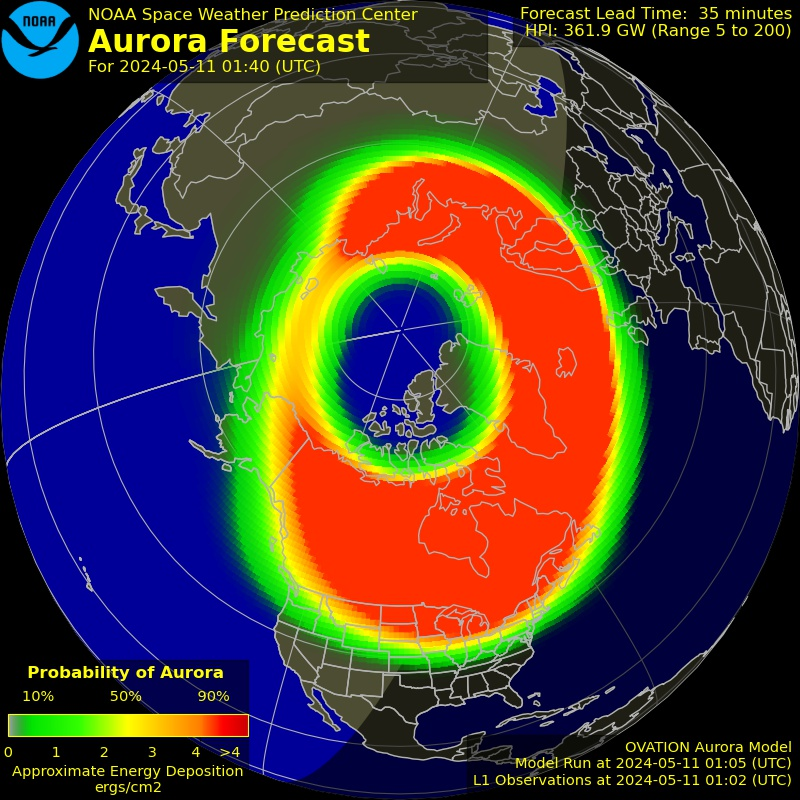
NOAA Aurora Forecast channel is a perfect visualization of probability of an aurora and its intensity. Usually, the calculated Aurora Oval is having mostly greenish colours, but occasionally, its middle part turns yellow or red. That change in colour is quite important for higher mid-latitudes and indicates good chances of seeing a visual aurorae (even if the Oval is not quite reaching your latitude).
Pay particular attention to HPI (Hemispheric Power Index) value. That is one hour ahead forecasted amount of solar wind energy in gigawatts around Earth poles. Having the value around 130-140 GW almost certainly means a visual aurora in higher mid-latitudes.
There could be situations, where HPI is relatively low (around 50-60) and the oval is mostly green, however Aurora is reported on higher mid-latitudes. That was the case on 2023-09-13, so always cross check with Kiruna magnetometer, our VLF aurorae plotter graphs and other indexes on this page.
NOAA Alerts section is very usefull for advance notices. Those alerts is a live data stream coming directly from NOAA. There you can read through current solar activity events and some early forecasts including geomagnetic storms and aurorae possibility.
Kiruna (68deg.) and Tormestorp (56deg.) magnetometers are another great and popular instruments in Europe, measuring magnetic field strenght and set in Swedish towns of Kiruna and Tormestorp at the Institute of Space Physics facilities. It may look a bit frustrating to understand the magnetometers' graphs, so to simplify - just look at the deflection rate. Strong deflections from its typical day run could indicate a good chance of visual or photographic aurorae. A typical Kiruna magnetometer's graph with a strong Aurora ongoing (recorded on the night of 2023-09-25). A special note on Tormestorp magnetometer - as the instrument is is located at 56deg. it is less sensitive to higher latitude aurorae, therefore higher deflection on Tormestrop plotter would likely indicate an Aurora moving further South. A good example of Tormestorp auroral graph on the night of 2023-09-25 where many auroral reports were coming from Ireland and the UK.
If you are not in Europe, you would need to look at other magnetometers, such as in Boulder, USA or elsewhere, closer to your location.
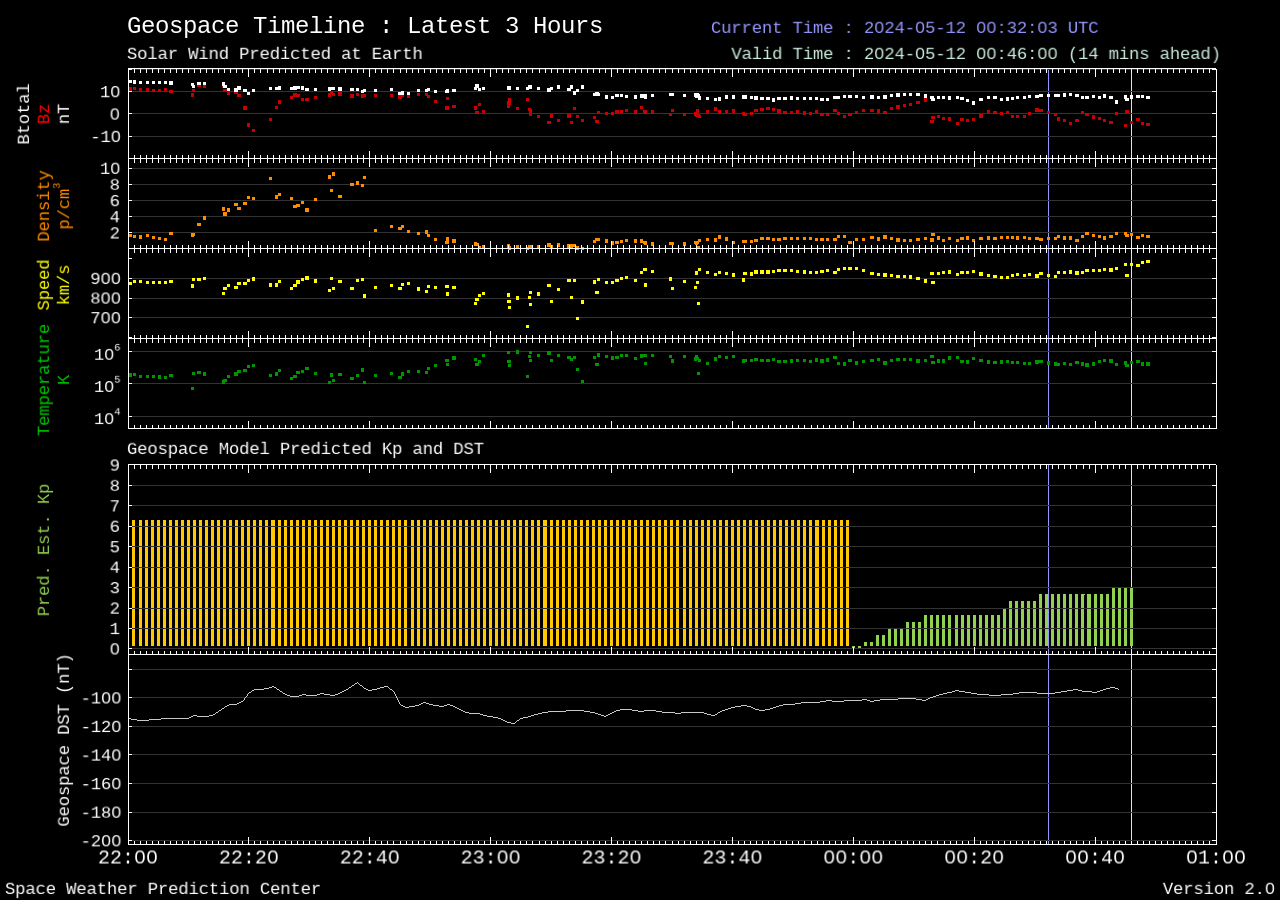
Bz/Bt - Interplanetary Magnetic Field (IMF ) direction and strength. In general, we want to see Bz value negative (-) around or below -10nT and Bt (IMF strength) value as high positive (+ ) as possible. The most current, live NOAA feed's Bz value is displayed at the top right of this section menu.
Speed km/s - solar wind speed. Values above 500 km/s could be an indication of a geomagnetic storm coming. Normally, solar wind values are around 300 km/s.
Kp (planetary) index is another well known indicator of aurorae and geomagnetic storm probability. The above Kp plot displays raw NOAA data of the Index for the past six hours. Kp values are measured from 0 to 9 with values over 6 means good chances of higher mid-latitude aurorae. See below NOAA image for reference.

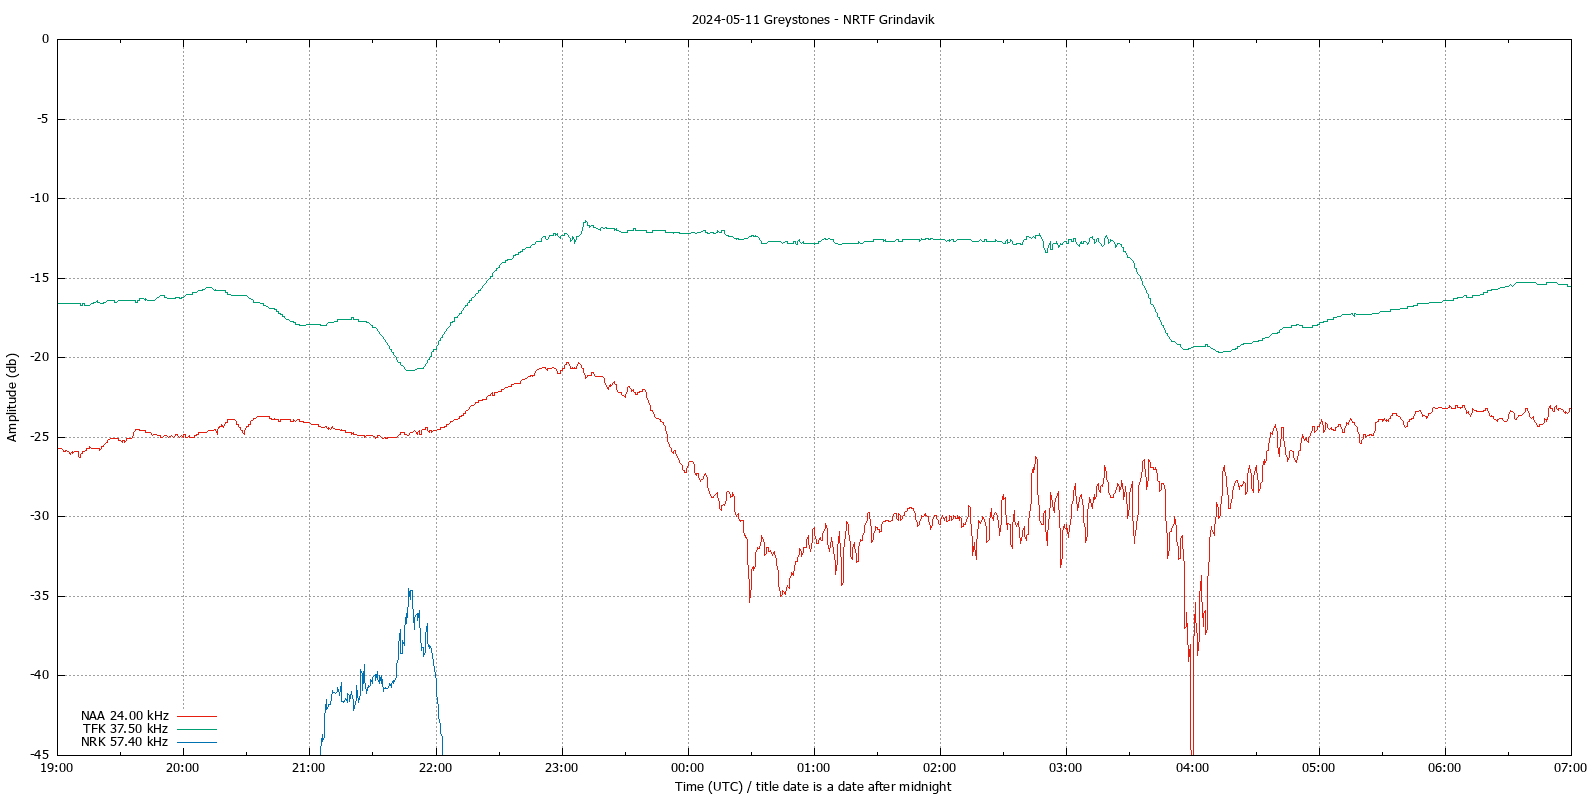
Ionospheric VLF plotter is our very own, experimental feature. We have a detailed guide of how to read the graphs in the User Articles section. The plotter is based on continuous measurement of the lower ionosphere's state. During potential aurorae both green and blue plotter graphs starts to deflect heavily within a short period of time, usually minutes. For a chance of higher mid-latitude Aurora, a graph deflection rate should be in the range of 10 - 30db (higher is better). Similar accompanying red graph deflection means very good chance of a visual Aurora. During very strong auroral events the graphs could behave differently (see one of the exception reports). You can browse through our Plotter Archive section, where we keep nightly recordings of the auroral plotter and make your own judgement. One good example recording is of 2023-03-24 where multiple reports of photographic and visual Aurora were coming from all over Ireland (NOAA HPI value that night jumped up to 139.4 GW). An exception example would be one of the strongest Auroras recorded in Ireland on 2024-05-10 where an HPI value raised to rarely seen 361.9 GW
The plotter graph is clickable and opens up in a new window for better viewing experience.